General
One of the essential factors in any risk analysis concerning lightning protection is the local density of cloud to ground lightning, expressed in lightning strikes per km2 per year, which should be determined from lightning location system data.
In Austria, the lightning frequency has been recorded nationwide since 1992 using the Austrian Lightning Detection & Information System (ALDIS).
Lightning density is defined as the average number of lightning strikes per km2 per year.
Since this is an average value both temporally (over several years) and spatially (over a freely selectable grid of, for example, 1 km2 x 1 km2, 10 km2 x 10 km2, or individual districts or municipalities), the values of lightning density are not independent of the selected evaluation criteria. The standard IEC 62858 specifies the criteria that a lightning location system must meet in order to provide high-quality lightning density data and how to determine the lightning density from the lightning location data.
ALDIS Lightning Location Data
Lightning location data has been available in Austria since 1992. In the 26 years from 1992 to 2017, approximately 4,300,000 lightning strikes were detected in Austria. If this number were averaged over the total area of Austria of 83,858 km2, it would result in an average lightning density of about 2 lightning strikes per km2 per year. However, locally, the values of lightning density vary, for example, 0.75 for Vienna and more than 4.0 in some areas in Styria.
Lightning Density Determination According to IEC 62858:2015
The lightning density changes from year to year and from place to place. Lightning density is evaluated on a grid, with the grid size depending on the number of lightning strikes in a cell and the required accuracy of the lightning density. To achieve acceptable accuracy, IEC 62858:2015 requires a minimum of 80 lightning strikes in a cell. With a grid size of 3 km x 3 km and 10 years of lightning data, this condition is met at a lightning density of 0.9 lightning strikes per km2 per year. To avoid undesirable effects at the edge of a cell, a finer grid is used for calculation. The following example illustrates the calculation.
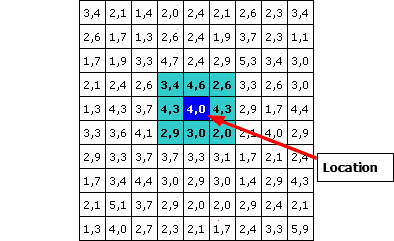
As the graph shows using the example of a randomly selected area, within a small area of 10 km by 9 km, lightning density values between 1.1 and 5.9 strikes per km2 per year occur. There is a clear dependence on local topographic conditions (e.g., low lightning frequency in valleys and rapid increase in lightning density with increasing altitude). The average over the entire district yields a lightning density of 3.03 strikes/km2 per year.
As can be seen from the table above, the lightning density can vary relatively strongly between neighboring segments. If the location of your query is in the dark blue marked 1 km x 1 km segment (lightning density 4.0), then the average is calculated from this central segment and the surrounding eight segments during the evaluation. Thus, the lightning density value provided represents an average over a 3 km x 3 km area and amounts to: (4.0 + 3.4 + 4.6 + 2.6 + 4.3 + 4.3 + 2.9 + 3.0 + 2.0) : 9 = 3.46
For the selected location, the value 3.46 is given as the result of your query in this example.